
Not everyone responds to your HR survey: How can you avoid biased results?
16.11.2026Imagine your organization has 500 employees, and you launch an employee engagement survey. Eventually, 150 employees complete it. A decent response rate, but when you look at the results, something stands out: 80% of respondents are white-collar employees, even though they only make up 55% of your workforce. Blue-collar employees are clearly underrepresented.
Can you simply apply the average engagement score to your entire organization? Perhaps office employees are generally more satisfied than their operational colleagues. In that case, the uneven distribution could give you a distorted picture of engagement across your organization.
written by Lotte Van der Sijpt.
Fortunately, statistical techniques can help address these differences. But when is it actually necessary to make adjustments? And should you use weighting or resampling?
In this blog, we'll walk you through a practical step-by-step approach to assessing the representativeness of your HR data. We'll also explain which methods you can use to correct uneven distributions and what to keep in mind when drawing reliable conclusions.
When should you make your HR data more representative?
An uneven distribution in your survey doesn't automatically mean your results are unreliable. The key question is whether differences between your respondents and your entire workforce (i.e., the population you want to study) could bias your conclusions.
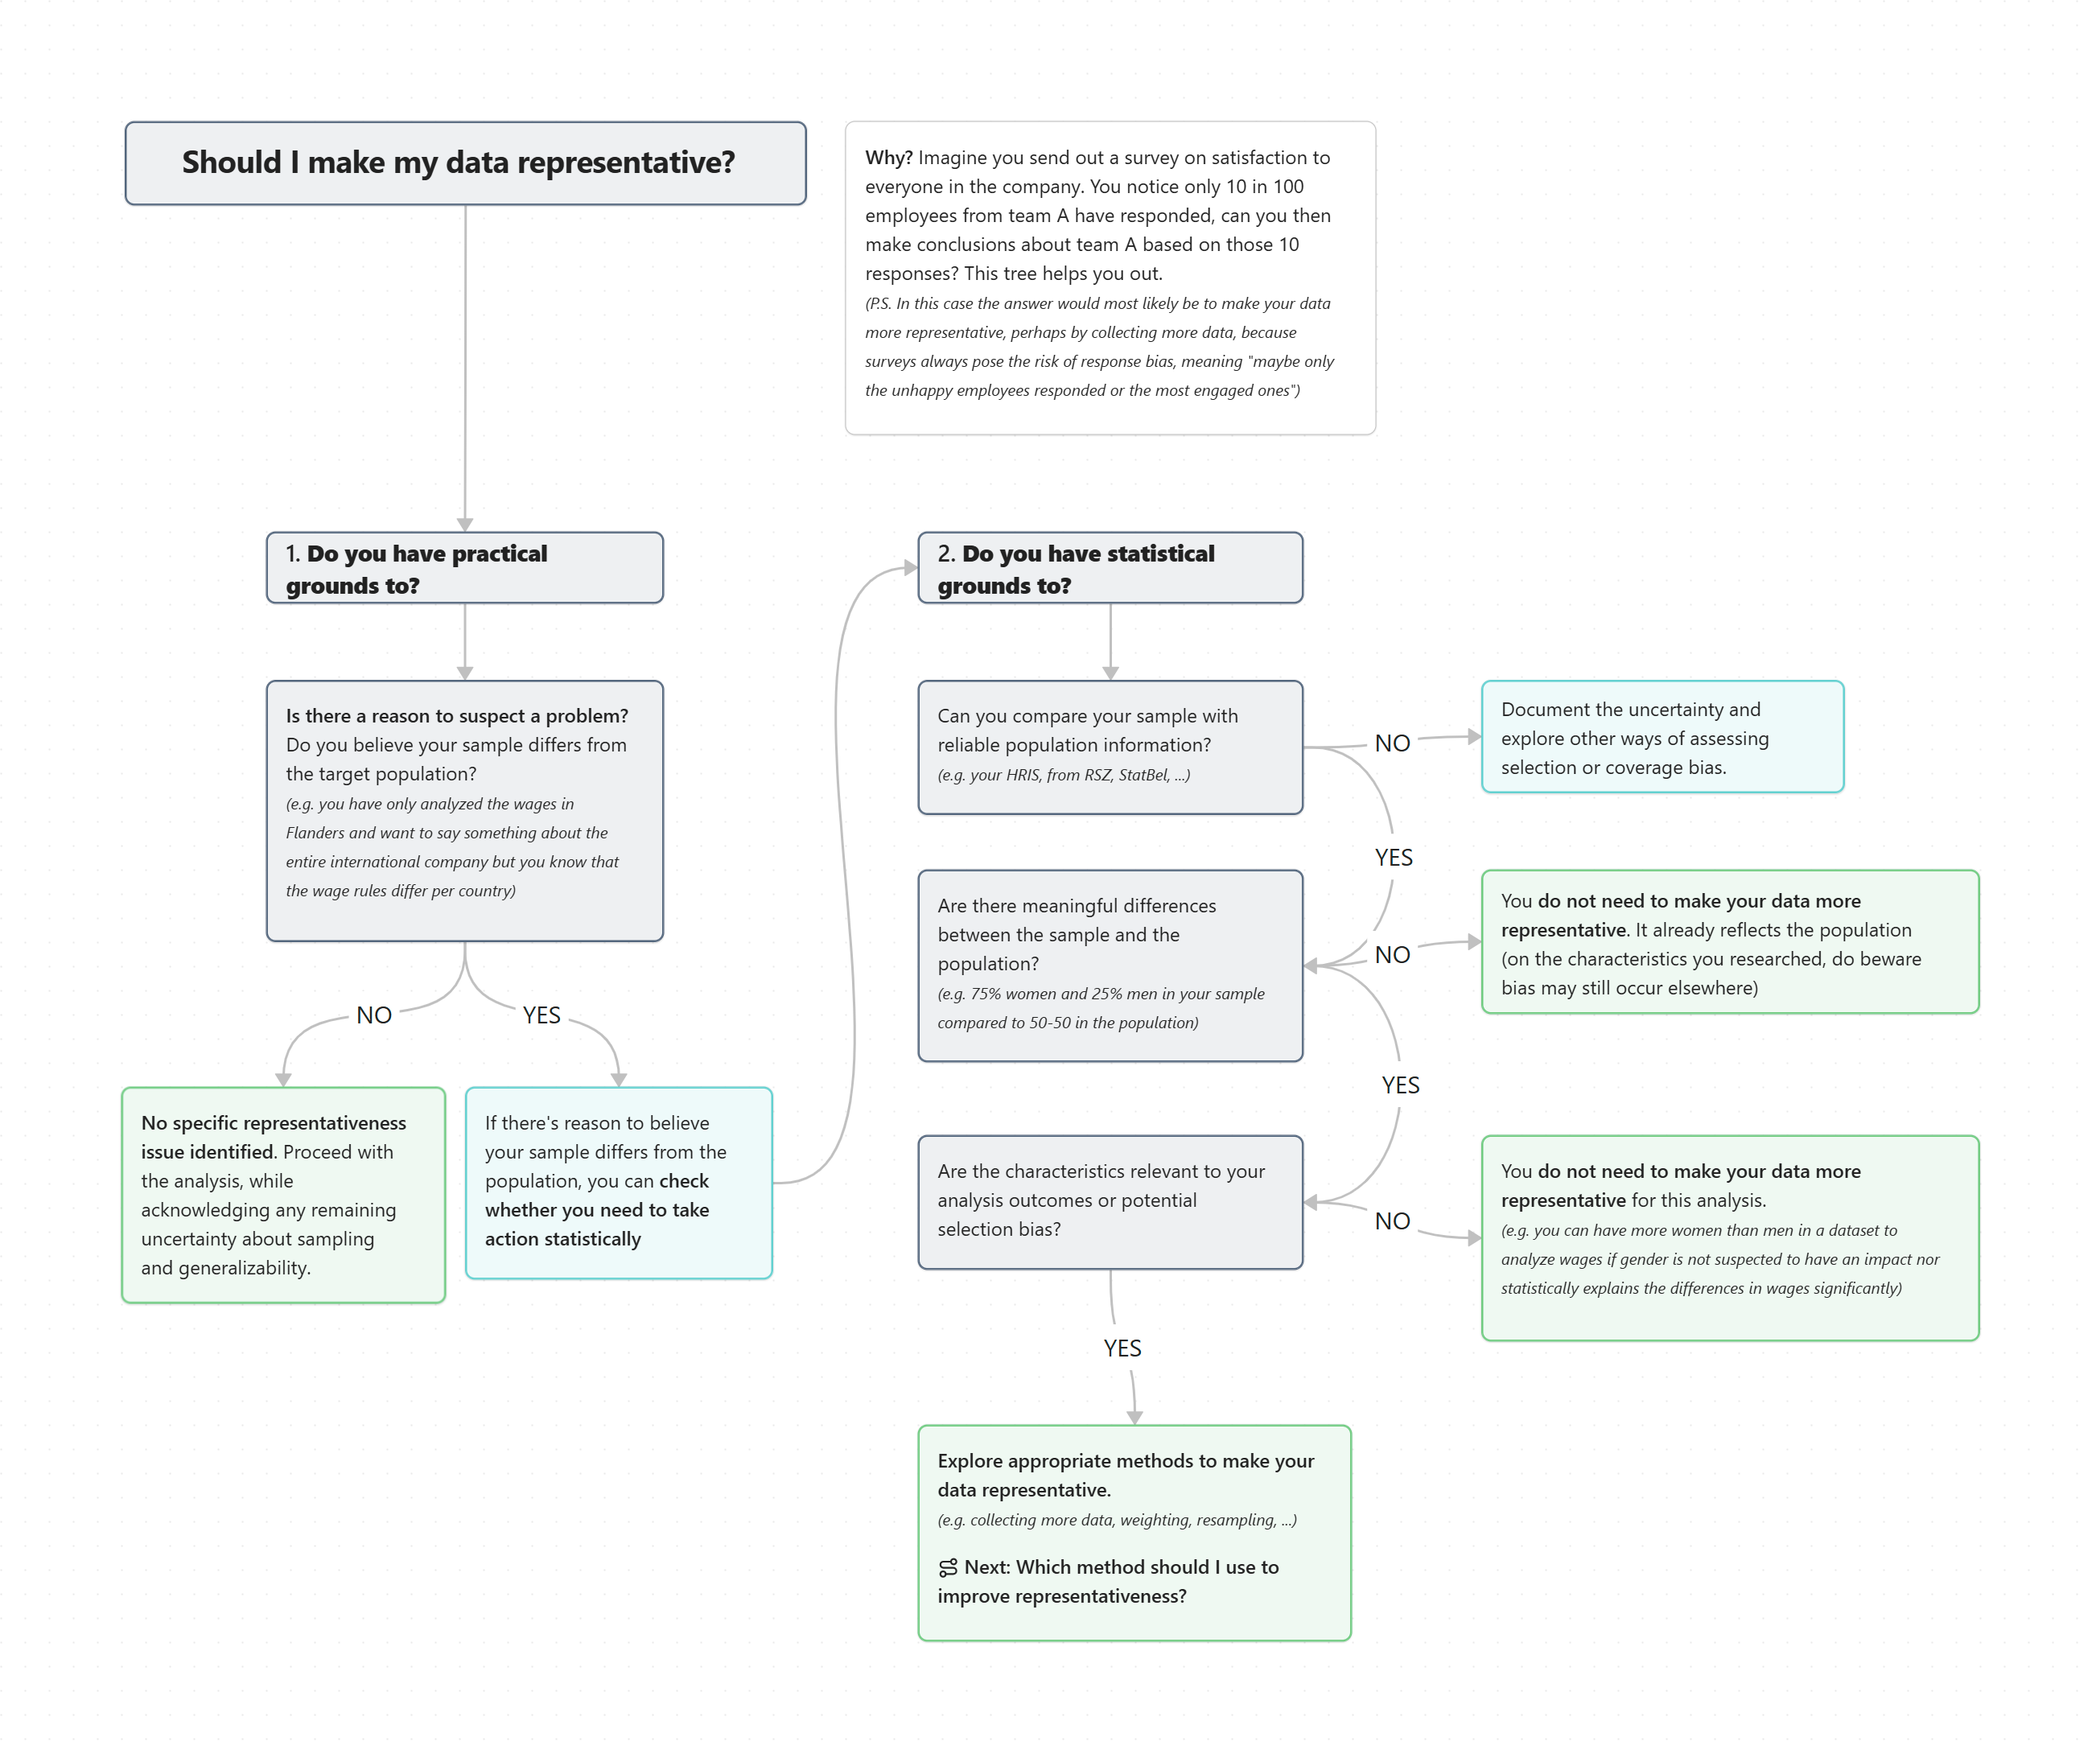
To assess this, you can use our decision tree below or ask yourself the following three questions.
1. Do you have reason to believe your sample differs from your population (i.e., your entire organization)?
Start with what you know about your organization. Are certain departments, job categories or age groups noticeably underrepresented? Perhaps you already know that blue-collar employees have less access to the survey because they don't work at a computer every day.
If you have no specific indications of a problem, you can generally proceed with your analysis, as long as you remain cautious about drawing conclusions for the entire organization.
2. Can you demonstrate these differences using population data?
Compare the composition of your respondents with that of your entire workforce. You can use data from your HR system for this.
In our example, white-collar employees make up 55% of the organization but account for 80% of respondents. That's a clear difference. Without reliable population data, it's difficult to identify or correct such discrepancies.
3. Are these differences relevant to what you want to investigate?
Not every discrepancy affects your results. Imagine that women are overrepresented in a survey, but engagement scores barely differ between men and women. In that case, the uneven distribution doesn't necessarily lead to a biased overall engagement score.
In our example, however, blue-collar and white-collar employees may have very different experiences with their jobs, managers or working conditions. Their unequal representation could therefore influence the average engagement score.
Are there relevant differences between your sample and population? Then it's worth exploring whether you can make your data more representative. For example, by collecting additional responses or applying statistical techniques such as weighting.
Method 1 – Weighting: Not every respondent carries the same weight
One way to correct an uneven distribution is weighting. With this method, you keep all survey responses but assign greater weight to some respondents than to others.
In our example, white-collar employees are overrepresented: they make up 80% of respondents but only 55% of the workforce. The opposite is true for blue-collar employees: they represent 45% of the organization but only 20% of respondents.
To correct this, we calculate a weight for each group: Weight = Proportion in the population ÷ Proportion in the sample
| Group | Population | Respondents | Weight |
|---|---|---|---|
| White-collar employees | 55% | 80% | 0.69 |
| Blue-collar employees | 45% | 20% | 2.25 |
What does this mean in practice? When calculating the average engagement score, a white-collar employee's response now counts for approximately 0.69, while a blue-collar employee's response counts for 2.25. This ensures that both groups contribute to the overall result in proportion to their actual share of the workforce.
Let's say white-collar employees have an average engagement score of 7.5 out of 10, compared to 6.5 for blue-collar employees.
Without weighting, the average engagement score is 7.3 out of 10. After weighting, it becomes 7.05 out of 10. That's a difference of 0.25 points, without changing a single response!
Weighting can therefore help you obtain a more representative picture of your organization, provided you have reliable population data and the characteristics you weight on are relevant to your research.
Keep in mind: weighting doesn't solve everything. If, for example, mainly satisfied blue-collar employees completed the survey, their engagement score may still be biased. Giving their responses more weight doesn't automatically eliminate that bias. After all, you can only correct for differences you know about and can measure, not every possible reason why employees did or didn't participate.
Method 2 – Resampling: Creating a different sample
Another option is resampling. While weighting keeps all responses and adjusts their influence, resampling involves selecting observations again from your existing dataset.
Let's return to our example. Of the 150 respondents, 120 are white-collar employees (80%) and 30 are blue-collar employees (20%). However, the actual workforce consists of 55% white-collar employees and 45% blue-collar employees.
Using stratified resampling, we can create a new sample that better reflects these proportions. Suppose we want to create a sample of 100 responses:
- We randomly select 55 responses from white-collar employees.
- We select 45 responses from blue-collar employees. Since only 30 blue-collar employees participated, some responses must be selected more than once. This is called oversampling with replacement.
This gives us a new dataset in which the distribution of white-collar and blue-collar employees matches that of the organization.
But how is this different from weighting? With weighting, we use all 150 original responses but assign different weights to them. With resampling, we change the composition of the dataset by selecting responses again. Some employees may therefore appear multiple times, while others may not be selected at all.
Resampling can be useful when you need a dataset with a specific group distribution, for example for a simulation or a particular analytical technique. However, it's not automatically the best solution for calculating an average engagement score. For that purpose, weighting is generally simpler and more efficient, since you don't have to discard any original responses.
Another important consideration: selecting the same responses multiple times doesn't create new information. You still only have 30 unique responses from blue-collar employees.
What's more, ordinary bootstrapping, where observations are randomly resampled from the existing sample, doesn't automatically make an uneven distribution representative. To achieve that, your resampling approach must explicitly account for the actual population proportions.
How can you address common pitfalls in practice?
Weighting and resampling can help correct uneven distributions in your HR data. But sometimes new challenges arise during the process. Fortunately, there are practical ways to address them.
1. Some groups are barely represented
Imagine that only five blue-collar employees completed your survey. With weighting, those five responses could receive very large weights. With resampling, the same responses might be selected repeatedly. In both cases, your results become highly dependent on just a handful of employees.
What can you do?
- Collect additional responses from the underrepresented group, for example through targeted reminders or a more accessible survey channel.
- Combine small groups in your reporting if this makes sense substantively and the groups are sufficiently comparable.
- Report cautiously when collecting additional data isn't possible. For example, avoid drawing separate conclusions about groups with very few respondents (N < 10).
2. Some respondents receive excessively large weights (greater than 3)
Suppose you discover that certain respondents receive a weight of 4.5. Their responses then count 4.5 times as much as a response with a weight of 1. This means that just a few respondents could have a disproportionate influence on your results.
What can you do?
- Check the distribution of your weights. A weight greater than three times the average weight, for example, may be a reason to investigate further.
- Apply weight trimming: limit exceptionally high weights to prevent individual responses from having too much influence.
- Check representativeness again after trimming. Adjusting weights can cause your sample to deviate slightly from the actual population distribution.
3. Your sample differs on several characteristics at once
Imagine you've corrected the distribution of blue-collar and white-collar employees, but then discover that younger employees and certain departments are also underrepresented. Weighting on a single characteristic may not be sufficient.
What can you do?
- Use post-stratification: divide respondents into groups based on combinations of characteristics, such as job category and age, and calculate a weight for each group. This does require a sufficient number of respondents in each group.
- Use raking (iterative proportional fitting): this technique adjusts weights step by step until the sample aligns with multiple known population distributions, such as job category, age and department. You don't necessarily need to know the exact population distribution of every combination.
- Choose relevant characteristics: focus on characteristics that are associated with the likelihood of participating and potentially with the outcome you're investigating.
Key takeaway
Whichever method you choose, statistical adjustments can only account for information you actually have. If mainly dissatisfied employees don't participate, but you have no way of identifying this, bias may still remain.
That's why a good survey always starts with good data collection.
Want to learn more?
Would you also like to gain more insights into employee engagement within your organization? Subscribe to our bimonthly newsletter for tips and trends in HR analytics, or get in touch with us.